<script async src="https://pagead2.googlesyndication.com/pagead/js/adsbygoogle.js?client=ca-pub-7001450216977829"
crossorigin="anonymous"></script>
THE AMERICAN FINANCIAL CRISIS — THE REAL NUMBERS: A Devastating Autopsy of Wall Street’s Secret Betrayal
Uncover THE AMERICAN FINANCIAL CRISIS — THE REAL NUMBERS. Dive into the terrifying $29T secret bailout, the foreclosure tsunami, and how to protect your wealth.
GLOBAL EMPLOYMENT TRENDS 2026, AI JOB IMPACT, TECH LAYOFFS 2026, FUTURE OF WORK, JOB MARKET TRENDS WORLDWIDE, AI REPLACING JOBS, HIRING SLOWDOWN 2026, EMPLOYMENT CRISIS GLOBAL, WORKFORCE TRANSFORMATION, JOBS AND AI
Buzz Leaps
7/11/20269 min read
Did you know that the true cost of the 2008 financial meltdown wasn't the highly publicized $700 billion TARP bailout, but rather a staggering $29.6 trillion in cumulative secret loans and asset purchases by the Federal Reserve? Or that the crisis permanently erased $70,000 in lifetime income for the average American? When you peek behind the curtain of THE AMERICAN FINANCIAL CRISIS — THE REAL NUMBERS, the truth is far more terrifying than the headlines suggested. While the public was distracted, millions lost their homes and jobs, whereas a select group of mega-banks received unprecedented lifelines. Welcome to the untold, data-driven story of the Great Recession.
In this comprehensive deep dive into THE AMERICAN FINANCIAL CRISIS — THE REAL NUMBERS, we will explore the raw data, the hidden bailouts, the foreclosure tsunami, and the devastating impact on the American household. This isn't just a history lesson; it is a financial autopsy designed to show you exactly why you can never rely entirely on the traditional economic system for your survival.
Part 1: The Illusion of Prosperity and the Shadow Banking Collapse
To understand THE AMERICAN FINANCIAL CRISIS — THE REAL NUMBERS, we first have to look at the unsustainable foundation upon which the mid-2000s economy was built. The crisis was precipitated by the bursting of the United States housing bubble and the subsequent subprime mortgage crisis.
During the years preceding the crash, U.S. households and financial institutions became dangerously overleveraged. In 1981, U.S. private debt was 123 percent of the gross domestic product (GDP); by the third quarter of 2008, it had skyrocketed to a breathtaking 290 percent of GDP. U.S. home mortgage debt relative to GDP expanded from an average of 46 percent in the 1990s to 73 percent by 2008, reaching roughly $10.5 trillion. Consumers were using their homes as ATMs; free cash extracted from home equity doubled from $627 billion in 2001 to $1.428 trillion in 2005.
However, the real danger was brewing out of sight in the "shadow banking" system. Financial intermediaries moved away from traditional banking and relied heavily on short-term debt to fund inherently risky financial activities. Wall Street's appetite for mortgage-backed securities (MBS) and collateralized debt obligations (CDOs) incentivized a collapse in lending standards. Lenders pushed predatory loans, and by 2006, the top five U.S. investment banks (Bear Stearns, Goldman Sachs, Lehman Brothers, Merrill Lynch, and Morgan Stanley) were operating with extraordinarily thin capital, boasting leverage ratios as high as 40-to-1. At that level of extreme leverage, less than a 3 percent drop in asset values was enough to completely wipe out a firm.
When the housing bubble finally popped and home prices began to fall, the shadow banking system experienced the modern equivalent of a bank run.
Part 2: The Foreclosure Tsunami — A Nation Evicted
The most visible and heartbreaking metric of THE AMERICAN FINANCIAL CRISIS — THE REAL NUMBERS is the sheer volume of families who lost their homes. As housing prices declined by over 20 percent from their mid-2006 peak, borrowers with adjustable-rate mortgages could no longer refinance to avoid higher payments, leading to a massive wave of defaults.
The Escalation of Foreclosures (2007-2009) The foreclosure data compiled by RealtyTrac illustrates a terrifying acceleration of property losses:
2007: Lenders began foreclosure proceedings on nearly 1.3 million properties, representing a 79 percent increase over 2006.
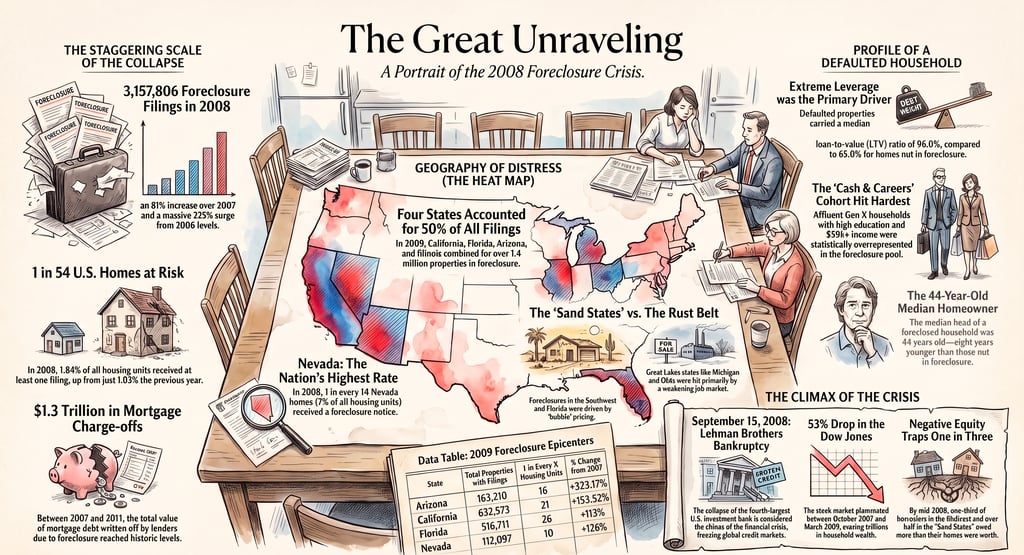
2008: There were 3,157,806 foreclosure filings (default notices, auction sale notices, and bank repossessions) on 2.33 million U.S. properties, marking an 81 percent increase from 2007. During this year, 1.84 percent of all U.S. housing units—one in 54—received at least one foreclosure filing.
2009: The crisis deepened further. Foreclosure filings hit a record high of 3,957,643 across 2,824,674 properties, a 120 percent jump from 2007. By this point, 2.21 percent of all U.S. housing units (one in 45) were caught in the foreclosure process.
2010: Even as the economy technically began to recover, foreclosures accounted for a massive 26 percent of all residential sales in the United States, selling at an average discount of 28 percent below the price of non-foreclosure properties.
The Geographic Epicenters The devastation was highly concentrated in specific regions. Four states—California, Florida, Arizona, and Nevada—accounted for more than 50 percent of the nation's total foreclosures in 2009.
Nevada: Led the nation with the highest foreclosure rate; in 2009, more than 10 percent of its housing units received a foreclosure filing. In 2010, foreclosure sales made up an astonishing 57 percent of all residential sales in the state.
California: Saw 632,573 properties receive filings in 2009 alone, an increase of nearly 21 percent from 2008.
Florida: Experienced a 34 percent increase in foreclosures in 2009, totaling 516,711 properties.
Who Was Hit the Hardest? An analysis of demographic data reveals that the crisis disproportionately affected vulnerable populations. A Pew Research Center study found that a 10-percentage point increase in the immigrant share of a county's population was associated with a 0.6 percentage point increase in its foreclosure rate. High-priced lending was also disproportionately directed at minority homebuyers, which tightly correlated with higher foreclosure rates in those counties.
However, the crisis also highlighted the dangers of household overreaching. Research by the Federal Reserve Bank of St. Louis cross-referenced foreclosure data with consumer profiles and discovered that the demographic group with the highest excess foreclosure rate was a segment dubbed "07X Cash & Careers". This was a relatively affluent group of Generation Xers with a median annual income of $59,500. Despite making up only 5.5 percent of the population, they accounted for 11.3 percent of all foreclosures. They purchased homes with extreme leverage, carrying a median loan-to-value ratio of 96 percent.
Part 3: TARP vs. The Federal Reserve — The Real Bailout Numbers
When analyzing THE AMERICAN FINANCIAL CRISIS — THE REAL NUMBERS, the public's anger was primarily directed at the Troubled Asset Relief Program (TARP), authorized by Congress in October 2008. But TARP was just a drop in the bucket compared to what the Federal Reserve was doing in secret.
The Troubled Asset Relief Program (TARP) Originally authorized to spend $700 billion, TARP was later capped at $475 billion by the Dodd-Frank Act. By the time the program concluded, the Treasury had disbursed $443.5 billion.
While highly controversial, TARP's bank support programs eventually turned a profit. The Capital Purchase Program disbursed $204.9 billion to 707 financial institutions and ultimately recovered $199.7 billion in principal. When factoring in dividends and interest, the program generated a net taxpayer surplus of $16.3 billion.
However, TARP's housing and auto industry programs operated at a severe loss. Funds aimed at helping homeowners avoid foreclosure disbursed $31.4 billion as non-repayable subsidies. The auto industry bailout (General Motors and Chrysler) disbursed $79.7 billion but resulted in a net taxpayer loss of $12.1 billion. Ultimately, TARP's lifetime net cost was calculated at $31.1 billion.
The Secret $29.6 Trillion Federal Reserve Bailout The true scale of the government's intervention was hidden within the Federal Reserve's emergency lending facilities. Invoking Section 13(3) of the Federal Reserve Act, the Fed acted as the ultimate backstop for the global financial system. For years, the Fed claimed its emergency lending peaked at around $1.2 trillion in late 2008.
However, an exhaustive audit and research by the Levy Economics Institute of Bard College exposed the truth: when you calculate the cumulative total of all originated loans and asset purchases, the Federal Reserve deployed a staggering $29.616 trillion.
Why the massive discrepancy? The Fed's $1.2 trillion figure was a snapshot of the maximum outstanding balance at a single point in time. But because the Fed was issuing overnight and short-term loans to keep insolvent banks afloat, these institutions were forced to continuously roll over their borrowing.
A breakdown of THE AMERICAN FINANCIAL CRISIS — THE REAL NUMBERS regarding the Fed's major cumulative lending facilities includes:
Central Bank Liquidity Swaps (CBLS): $10.05 trillion extended to foreign central banks to ease global dollar shortages.
Primary Dealer Credit Facility (PDCF): $8.95 trillion in overnight loans to primary dealers, accepting high-risk equities and sub-investment grade junk bonds as collateral while markets were collapsing.
Term Auction Facility (TAF): $3.81 trillion auctioned to depository institutions.
Term Securities Lending Facility (TSLF): $2.01 trillion.
Commercial Paper Funding Facility (CPFF): $737 billion.
The socialization of risk was highly concentrated. If we exclude the 10trillioninloansmadetoforeigncentralbanks,roughly83.9percent(16.42 trillion) of all the Fed's emergency assistance was funneled into just 14 mega-institutions. Citigroup cumulatively borrowed $2.5 trillion, Morgan Stanley drew $2.04 trillion, Merrill Lynch took $1.95 trillion, and Bank of America utilized $1.34 trillion. Wall Street's elites were handed a virtually unlimited lifeline at near-zero interest rates, saving them from the catastrophic consequences of their own reckless behavior.
Part 4: The Devastating Cost to Main Street
While the banking sector was made whole by the Fed's $29 trillion money printer, the average American was left to shoulder the consequences of a shattered economy. When evaluating THE AMERICAN FINANCIAL CRISIS — THE REAL NUMBERS, the evaporation of wealth is staggering.
The Destruction of Household Wealth U.S. household wealth fell from a peak of $69 trillion in 2007 to a trough of $55 trillion in 2009—a decline of $14 trillion (or roughly 24 to 26 percent when adjusted for inflation). The Federal Reserve Bank of Dallas estimated that the bottom-line cost of the 2007–2009 financial crisis was between $6 trillion and $14 trillion in lost economic output, equating to $50,000 to $120,000 for every single U.S. household.
However, when factoring in the destruction of "human capital"—the discounted flow of future wage income caused by the severe recession—the total wealth loss ranges from $15 trillion to $30 trillion, or 100 to 190 percent of the entire country's 2007 economic output.
The 70,000LifetimeIncomeHit∗∗PerhapsthemostdepressingstatisticcomesfromtheFederalReserveBankofSanFrancisco.BecausetherecessionloweredeconomicoutputsodeeplyandpermanentlyalteredthetrajectoryofU.S.GDP,theycalculatedthattheaverageAmericanwilltakeanestimated∗∗70,000 hit to their lifetime present-value income. The crisis literally stole years of earning potential from the working class.
Unemployment and National Trauma The human toll was immense. Some 8.7 million jobs were lost, pushing the U.S. unemployment rate from 5 percent in 2007 to a peak of 10 percent in October 2009. Millions faced extended bouts of unemployment, and the ranks of the underemployed swelled by 94 percent to 12 million. The median duration of unemployment soared to 16.3 weeks, elevated well above previous recession highs.
This caused a profound societal shift. Household formation dropped from an annual pace of 1.5 million to just 500,000 as working-age adults were forced to move back in with their parents. Enrollment in the Supplemental Nutrition Assistance Program (food stamps) skyrocketed by 70 percent, pushing 47.8 million Americans onto assistance. The percentage of citizens living in poverty rose from 12.5 percent in 2007 to 15.1 percent in 2010.
Part 5: The Fiscal Degradation of the U.S. Government
To combat the Great Recession, the U.S. government enacted massive fiscal stimulus programs, including the Economic Stimulus Act of 2008 and the American Recovery and Reinvestment Act of 2009. This, combined with plummeting tax revenues and skyrocketing social safety net outlays, blew a massive hole in the federal budget.
Between 2009 and 2012, the federal government recorded its largest budget deficits relative to the size of the economy since 1946. The U.S. ran a $1.4 trillion deficit (10 percent of GDP) in 2009 and an 8.9 percent deficit in 2010. Today, the U.S. national debt sits at over $35 trillion against an annual tax revenue base of $5 trillion, resulting in a persistent structural deficit. This immense debt burden leaves the federal government with severely reduced capacity to respond to the next inevitable financial crisis.
Furthermore, the average American household is repeating the sins of the past. Today, total U.S. household debt has climbed back to a record $18.8 trillion, encompassing $13 trillion in mortgages, $1.7 trillion in auto loans, and $1.7 trillion in student loans. With the personal savings rate plummeting below 4 percent, millions of families are once again walking a financial tightrope.
Part 6: Conclusion — Learn the Rules or Be Crushed by Them
When we analyze THE AMERICAN FINANCIAL CRISIS — THE REAL NUMBERS, the ultimate takeaway is a harsh reality check: The system is designed to protect the institutions at the top, not the individuals at the bottom. Wall Street was made whole through a $29.6 trillion central bank liquidity pipeline, while Main Street was left to absorb a $70,000 lifetime income loss per person, the evaporation of $17 trillion in household wealth, and the foreclosure of millions of homes.
This is the exact reason why I am so passionate about financial independence.
I am Buzz Leaps, author and publisher of motivational books. My mission is to encourage people to learn high-value, scalable skills that can help them become completely independent. The data above proves one undeniable fact: you cannot rely on a traditional job, a bank, or the government to save you when the system breaks down. They will save themselves first. You must become self-reliant. You must build your own economy.
If this deep dive into the real numbers of the 2008 crash has opened your eyes to the fragility of the traditional financial path, I highly encourage you to check out my recent book, WHEN THE MONEY RUNS OUT. It is the ultimate promoter to this blog and a practical guide designed to help you build resilience, master new income-generating skills, and ensure that when the next systemic shock hits, you aren't left holding the bag.
The squeeze is real. The debt is real. But your ability to rewrite your financial future is also real. Make sure you are the one holding the pen.
Reference Context & Authenticity Links: The data and statistics utilized in this blog were heavily researched from official government audits, Federal Reserve data, and leading economic institutes to ensure absolute authenticity:
Levy Economics Institute of Bard College: "$29,000,000,000,000: A Detailed Look at the Fed's Bailout"
Federal Reserve Bank of San Francisco: "The financial crisis at 10: will we ever recover?"
Federal Reserve Bank of Dallas: "How Bad Was It? The Costs and Consequences of the 2007–09 Financial Crisis"
U.S. Government Accountability Office (GAO): "Troubled Asset Relief Program: Lifetime Cost"
RealtyTrac: "Year-End 2009 Foreclosure Market Report"
Federal Reserve Bank of New York: "The Financial Crisis at the Kitchen Table: Trends in Household Debt and Credit"
Pew Research Center: "Through Boom and Bust: Minorities, Immigrants and Homeownership"
Federal Reserve Bank of St. Louis: "The Foreclosure Crisis in 2008: Predatory Lending or Household Overreaching?"